Filled with customer-driven user-friendly enhancements, collected over years of input from SV7 Users, SCORPION® Software Version 8 (SV8) takes data analysis to a whole new level, making it easier than ever to understand the data collected from your process. Developed specifically to support the new SCORPION® 2 hardware, SV8 also maintains compatibility and can be used with the older SCORPION® data loggers dating back to 1990. While significantly enhanced, it retains traditional on screen displays so that existing SV7 Users can easily transition to SV8 without having to relearn the data analysis/interpretation process.
SCORPION® Software (SV8) Food Safety Module
The SCORPION® Software (SV8) Food Safety Module is the newest addition to the SCORPION® 2 line of oven data logging equipment. This module enables SCORPION® users / bakers to easily comply with new Kill Step Validation required by the Food Safety Modernization Act (FSMA). After gathering the data, the SCORPION® 2 Software (SV8) food safety module makes it easy to calculate lethality and then generates a comprehensive report displaying cumulative log reduction. By combining this ease of measurement with robust data capture, the SCORPION® 2 System makes it simple to optimize your process while meeting food safety standards.
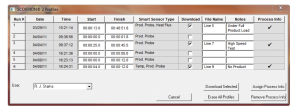
Data Download – choose one or several profiles to be Downloaded from the data logger. Edit profile “Start” and “Finish” times, enter File Names, add Notes and assign Process Information.
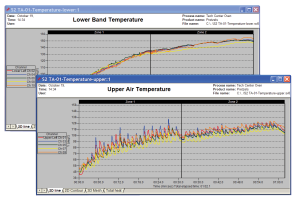
Each profile appears in its own SV8 window for analysis. Temperature Sensor Array data (containing upper and lower measurements) is automatically separated and displayed in upper and lower graphs.
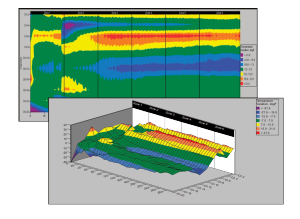
Data Analysis – the click of a button transforms 2D Line Graphs into 2D Contour or 3D Mesh Graphs for enhanced data analysis.
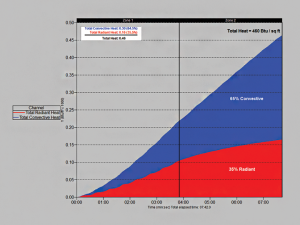
The Heat Flux Sensor measures the Total Heat experienced by the product and is conveniently displayed in the Total Heat Graph. The convective and radiant percentages are automatically calculated and displayed on the graph.
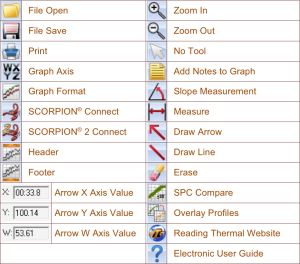
SV8 Toolbar – provides easy access to the major features of the software.
Printable Version

